 Peatland organisations and experts from across the globe have joined together to pledge their collective commitment to tackling climate change, protecting nature and forging ahead for the health of our planet. The Global Peat Press Project (GP3) supported by the United Nations Environment Programme’s Global Peatland Initiative (GPI) and the North Pennines AONB is a press and social media collaboration to share experiences and celebrate the successes of ongoing work that unites international peatland partners.
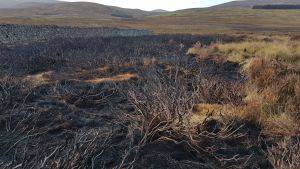
Around 12% of land in the UK is cover by peatlands – nearly three million hectares. Peatlands are a natural store of carbon but centuries of exploitation, particularly draining the peat to plant forests or grow crops, have led to damage and degradation, meaning that they are now a net source of UK greenhouse gas (GHG) emissions.
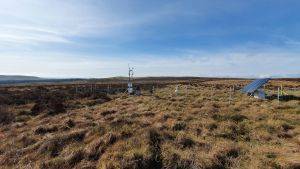
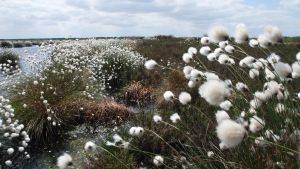
In healthy peatlands, the surface responds seasonally to changes in water and gas volumes by rising and falling, a phenomenon known as “bog breathing”. When averaged over time, the surface motion of a healthy peatlands shows net uplift, as a result of mass gain. In contrast, the surface a degraded peatland shows a net collapse, indicative of loss of mass and therefore carbon. Terra Motion Limited, a spin-out company from the University of Nottingham, have developed a novel technique that uses satellite radar data to measure this motion to millimetric accuracy for peatlands at local, regional and national scale. Ongoing research led by the University of Nottingham and the Thurso-based Environmental Research Institute (University of the Highlands and Islands) funded by NatureScot recently showed the huge potential of their APSIS™ land motion product for the monitoring of peatland condition.
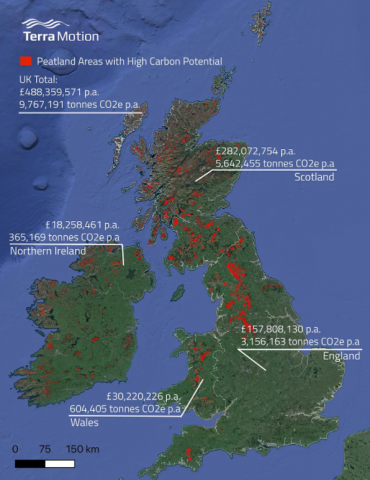
In the run-up to COP26, Terra Motion have surveyed the surface motion of all peatland areas across the UK and the Republic of Ireland using their APSIS™ technology to develop another product. Rather than condition categories, the map shows the average surface motion of peatland areas over a five-year period (2016-21) and was put together through an advanced analysis of thousands of satellite radar images gathered by the Sentinel-1 satellite. The map is particularly suited to highlighting areas with the rapid rates of collapse generally associated with actively eroding peatlands, which have the highest emissions but also the greatest potential for carbon offsetting in support of national commitments to reduce emissions and to achieve net zero.